Consider the story of a Frequentist and Bayesia from https://stats.stackexchange.com/a/2287
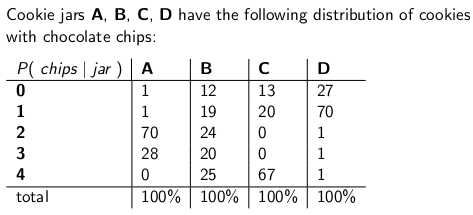
"When I was a child my mother used to occasionally surprise me by ordering a jar of chocolate-chip cookies to be delivered by mail. The delivery company stocked four different kinds of cookie jars -- type A, type B, type C, and type D, and they were all on the same truck and you were never sure what type you would get. Each jar had exactly 100 cookies, but the feature that distinguished the different cookie jars was their respective distributions of chocolate chips per cookie. If you reached into a jar and took out a single cookie uniformly at random, these are the probability distributions you would get on the number of chips:"
After setting up confidence interval as explained in the story you get the following CI:
The produced CI contains the correct jar based on the numbers of chips 70% of the time.
Now imagine setting up a 30% (for a 70% confidence interval) significance hypothesis test:
H0 = chips came from jar J (for example B)
H1 = chips came from another jar (not B)
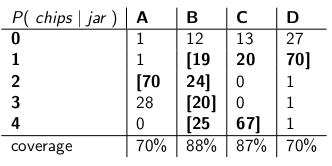
You can combine evidence for jar J as the most "likeliest" set of values it produces:
and use a rule: If the number of chips came from the most "likeliest" set we accept the H0 hypothesis and say that it came from Jar J, otherwise we reject H0 and say that it came from another jar.
Turns out we will not reject H0 at least 70% of the time, if H0 was true (because we used values from its "likeliest" set, which is realized at least 70% of the time).
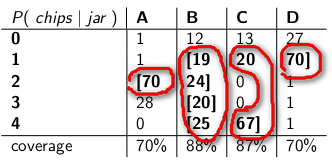
Uncovered values of P(chips|jar) serve as sort of evidence "against" that jar, because they are very unlikely (30% of the time).
The main deal comes from this statement:
Confidence Interval with A% coverage has 1 to 1 correspondence with all the values which are not rejected by the (100-A)% significance Hypothesis Test.
Why is this true? Consider all the values which are not rejected by the Null Hypothesis. Call it A0 - this is our confidence interval. If the value of your statistic was so extreme to be observed (i.e. rejected by test - 30% in our case) then it will not be contained in A0 (confidence interval), otherwise it would be, because we found all non rejected values!
Another way to think about is this: There is a true value of a parameter (jar) which has produced an extreme value of a statistic as evidence against itself (0 chips from jar A), the extreme value of statistic happens rarely (30% of the time), then as rarely it will not be contained in confidence interval (all values not rejected by hypothesis test).
How can you use this fact:
- You can now invert permutational hypothesis test to construct non-parametric confidence interval with a computer (called consonance interval).
- You can contruct Clopper-Pearson interval for binomal distribution (upper, lower or two-sided if you want) - just find all values of proprotion which are not rejected by P(proportion at hand | p0).